ACG Insights: Implications of Higher Rates
(Download the full report HERE)
Executive Summary
- Interest rates have trended lower for several decades, however recent events have spurred a shift towards a more hawkish Federal Reserve, and possibly a rising rate environment
- Currently faced with the historically tricky position of curbing inflationary pressures while simultaneously avoiding economic recession, the Federal Reserve will be watched closely by market participants over the coming weeks and months
- The effects rising interest rates could have on asset prices will be a top-of-mind question for investors going forward as markets grapple with a shifting monetary policy regime
Introduction
Beginning in the early 1980s, when the Federal Funds rate in the United States hit a historical high of 20%, interest rates have trended towards secular decline. A generally high demand for U.S. debt, actions taken by the Federal Reserve, in conjunction with other factors have pushed interest rates into the historically low-rate environment we have experienced in recent years. In fact, during the onset of the COVID-19 pandemic, the Federal Funds target rate was slashed to effectively zero, placing real interest rates firmly in negative territory in the United States. Real rates, as opposed to nominal rates, are after the effects of inflation.
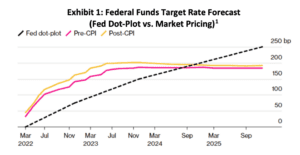
Although interest rates have been relatively low for an extended period of time now, cracks have begun to emerge in the “lower for longer” interest rate environment. Following several recent inflationary surprises and generally strengthening economic data, the Federal Reserve has announced it expects to end asset purchases (Quantitative Easing or “QE”) by March 2022. This clear shift in policy has opened the door for future rate hikes, though the pace and magnitude of hikes is a vigorously debated issue. Exhibit 1 shows current market pricing reflects a Federal Funds target rate of 200 basis points by the end of 2023, however some market participants expect a more rapid pace of rate hikes ahead. In addition, note that following the recently announced 7.5% year over year jump in consumer prices, market pricing adjusted slightly upward (also shown in Exhibit 1).
A Balancing Act
To further preface the current market environment, it may be useful to provide some background on the United States Federal Reserve or “central bank”. In a modern society, the overarching objective of a central bank is to promote the public good by means of monetary policy that fosters economic prosperity and social welfare. In the United States, as well as in most other countries around the world, the central bank operates under a more specific set of guidelines established by the government. This specific set of guidelines is commonly referred to as the “dual mandate”, which describes the Federal Reserve’s goal of promoting both maximum employment, and stable prices.
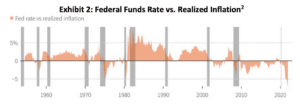
Today, the central bank is challenged to perform the balancing act of maintaining the aforementioned dual mandate. As inflation currently runs well above the Federal Reserve’s 2% long term target, the Federal Reserve has announced it will end asset purchases and is expected to raise rates at a quicker pace than previously anticipated. Although consensus among both elected officials and the Federal Reserve has settled on the need to curb inflation, the balancing act will be in withdrawing market liquidity and monetary support, while avoiding economic recession. The early 1980s under chairman Paul Volker provides an interesting case study in the potential effects of lifting rates too rapidly, as overly hawkish monetary policy was possibly the culprit for two subsequent recessions during the decade. Importantly, today’s circumstances differ from the 1980s. Exhibit 2 illustrates the Fed has never let inflation run hot for this long without policy action in the past, which may underscore the high likelihood for higher rates in the near future.
Download the full report HERE where we discuss
- Implications for Fixed Income Investors
- % Historical Treasury Yield Curve (One Year Ago, 30 Days Ago, Current)
- Implications for Equity Investors
- S&P 500 around start of hiking cycle
- U.S. Real 10-Year Yields and Equity Valuations (1997-2020)
Sources:
- Source: Bloomberg, CME
- Source: U.S. Federal Reserve, Bureau of Labor Statistics Note: Data is gap between federal funds rate and Consumer Price index; Gray bars are recessions
- Source: Blackrock
- Source: Alloya Corporate Credit Union, data as of 02/15/22
- Source: Bloomberg, FactSet, UBS


